
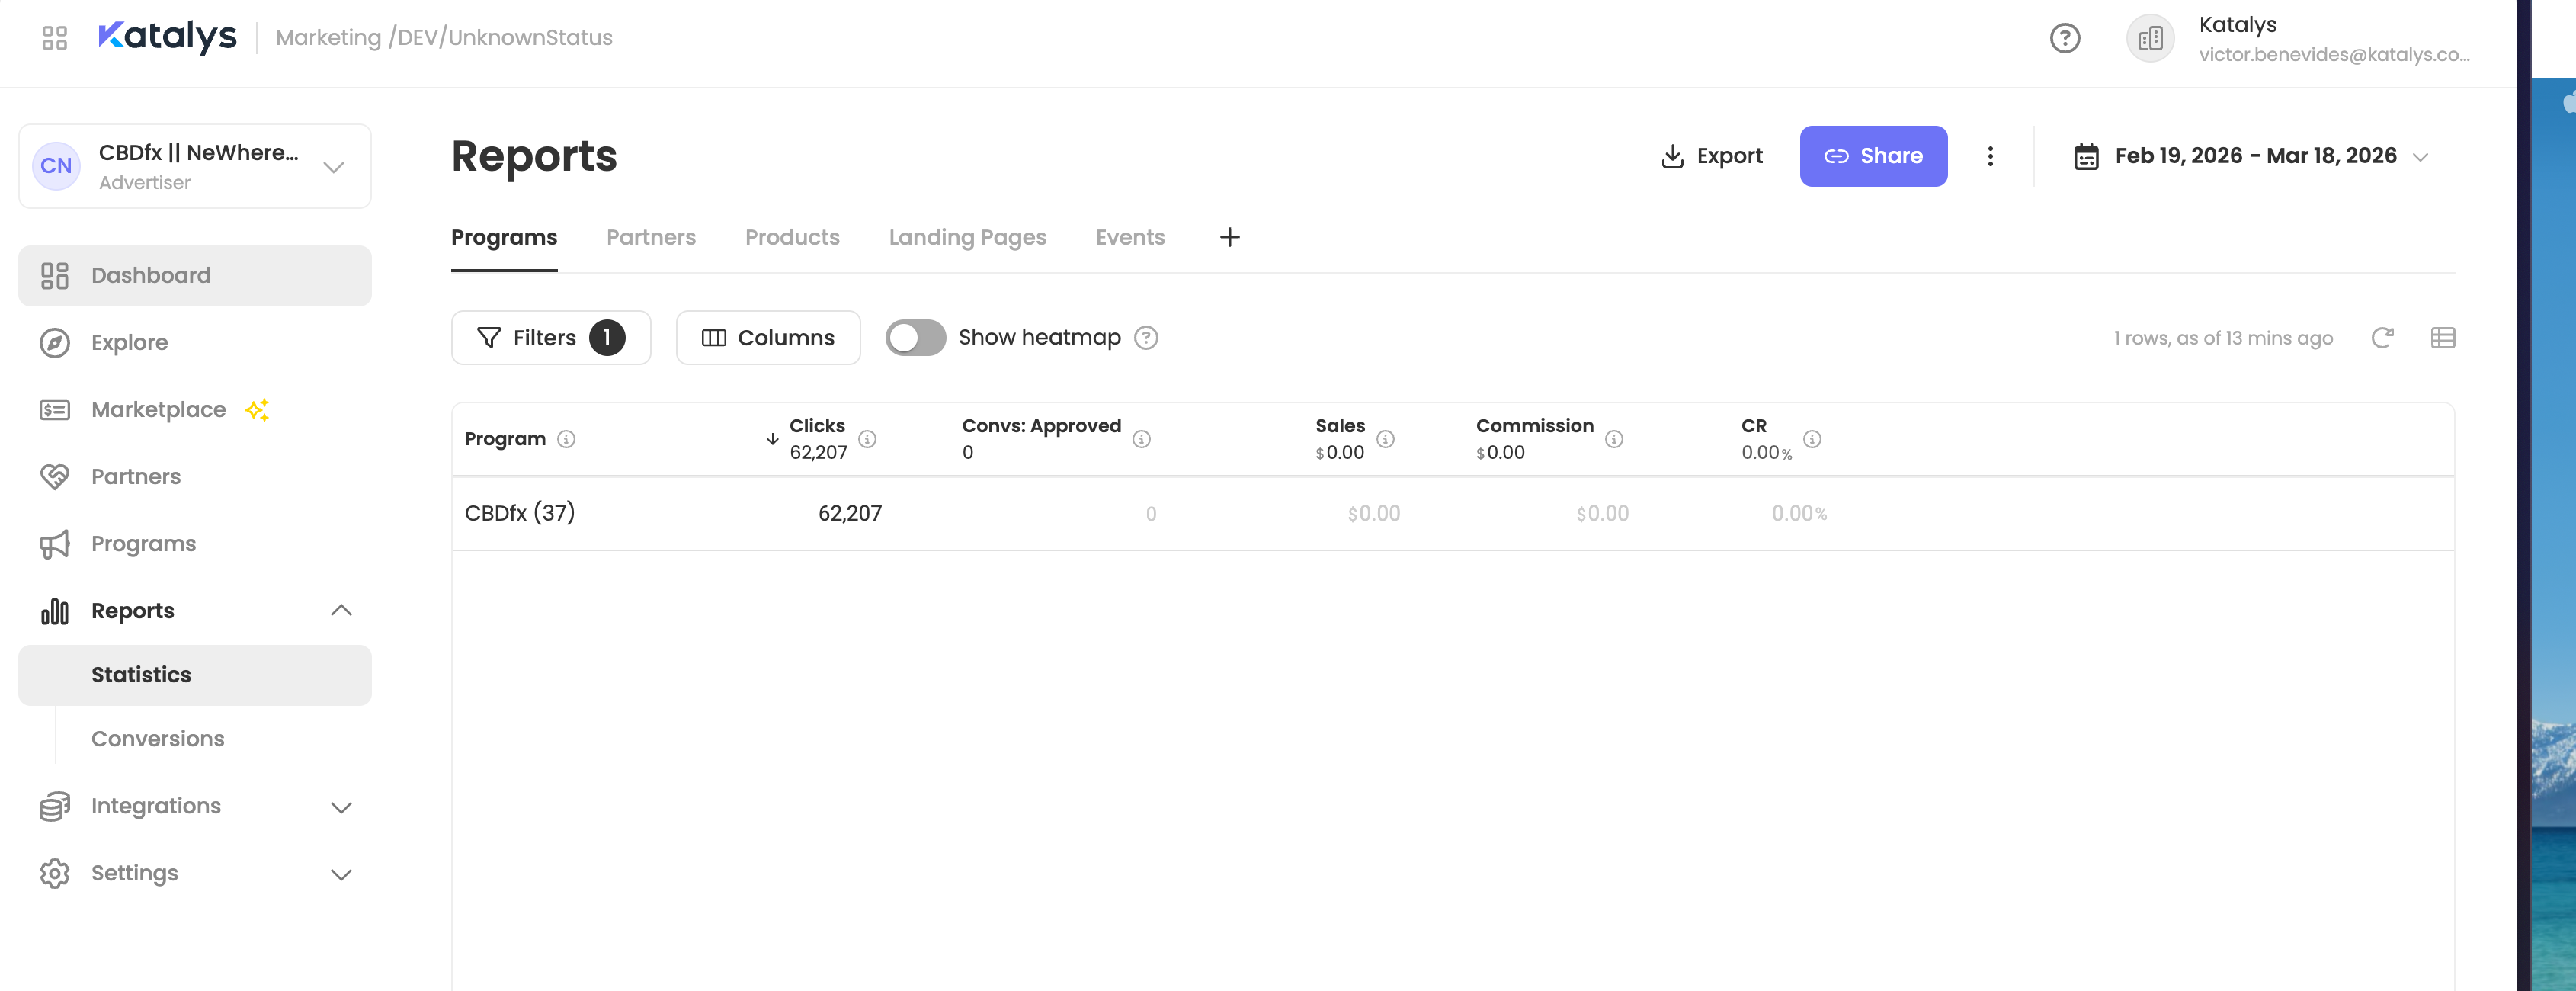
The Reports page includes pre-made tabs and supports custom tabs that you create and save. Further to this, you are also able to share the information on them with your team.
Pre-Made Tabs
Five default tabs are always available:
-
Programs — Performance metrics grouped by program (clicks, conversions, sales, commission, conversion rate).
-
Partners — Performance broken down by individual partner.
-
Products — Product-level reporting showing which items are driving results.
-
Landing Pages — Performance data for each landing page URL receiving traffic.
-
Events — A raw event log showing individual tracked actions.
Each tab displays its own set of columns, filters, and sorting options relevant to that data type.
Custom Tabs
In addition to the default tabs, you can create custom report tabs by saving a report configuration. Custom tabs appear alongside the pre-made tabs and are accessible via the “+” button in the tab bar:
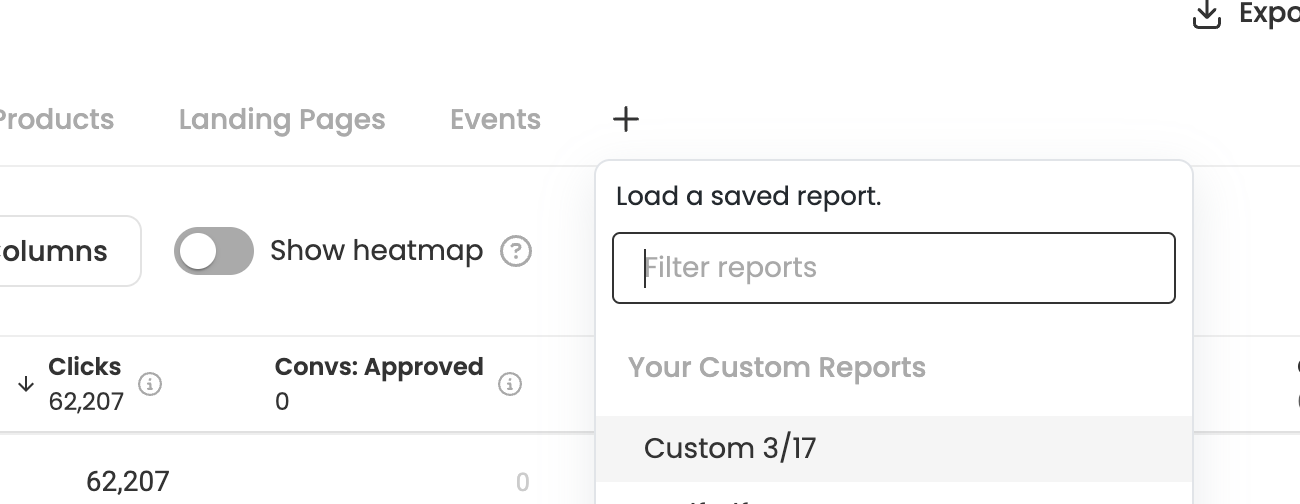
Custom tabs allow you to preserve a specific combination of filters, column selections, date ranges, and sorting so you can return to that exact view at any time.
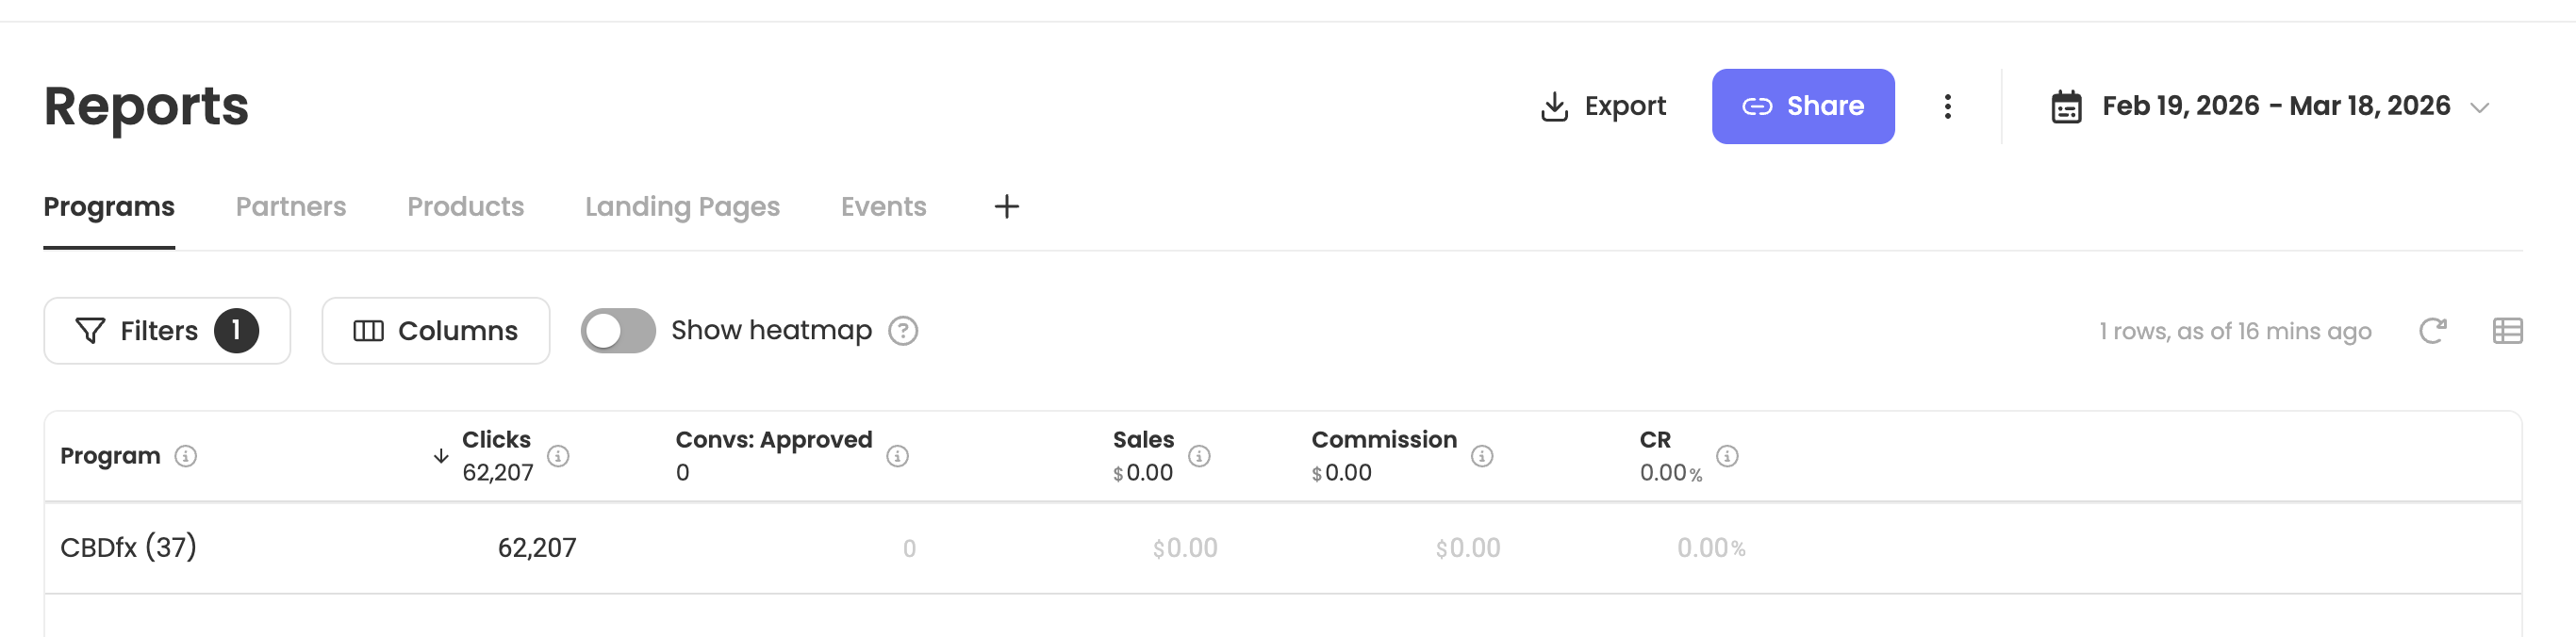
Report Toolbar
Each report tab includes a toolbar above the data table with the following controls:
-
Filters — Open the filters panel to narrow down the data. Active filter count is shown on the badge.
-
Columns — Choose which columns are visible and adjust their order.
-
*There are extra ones that are usually hidden by default
-
-
Show heatmap — Toggle a color heatmap overlay on the data for quick visual comparison.
-
Export — Download the current report data. This allows you to share the current view only
-
Share — Share the report or a view of the report (see below).
-
Date range — Adjust the reporting period using the date picker in the top-right corner.
Sharing Data
You can share data from these reports in two ways: Export and Share.
Export: When you export a report, you're taking the data offline as a file. You can then distribute that snapshot however you like — and anyone you share it with can work with it just as they would any CSV or spreadsheet.
Share: When you share a report, you're sharing the actual report configuration within Katalys with anyone who has access to the underlying data. This keeps everything in the system, ensures the information stays up to date, and lets recipients explore the data further on their own.
A saved report preserves: the selected data tab, active filters, visible columns and their order, sort configuration, and date range. The underlying data is always live — saving a report saves the view configuration, not a static snapshot.
Sharing a Report
Sharing a report gives another Katalys user access to the same saved report configuration, so they can open it and work with live data using the same filters and layout you defined. The link provided is what needs to be shared.
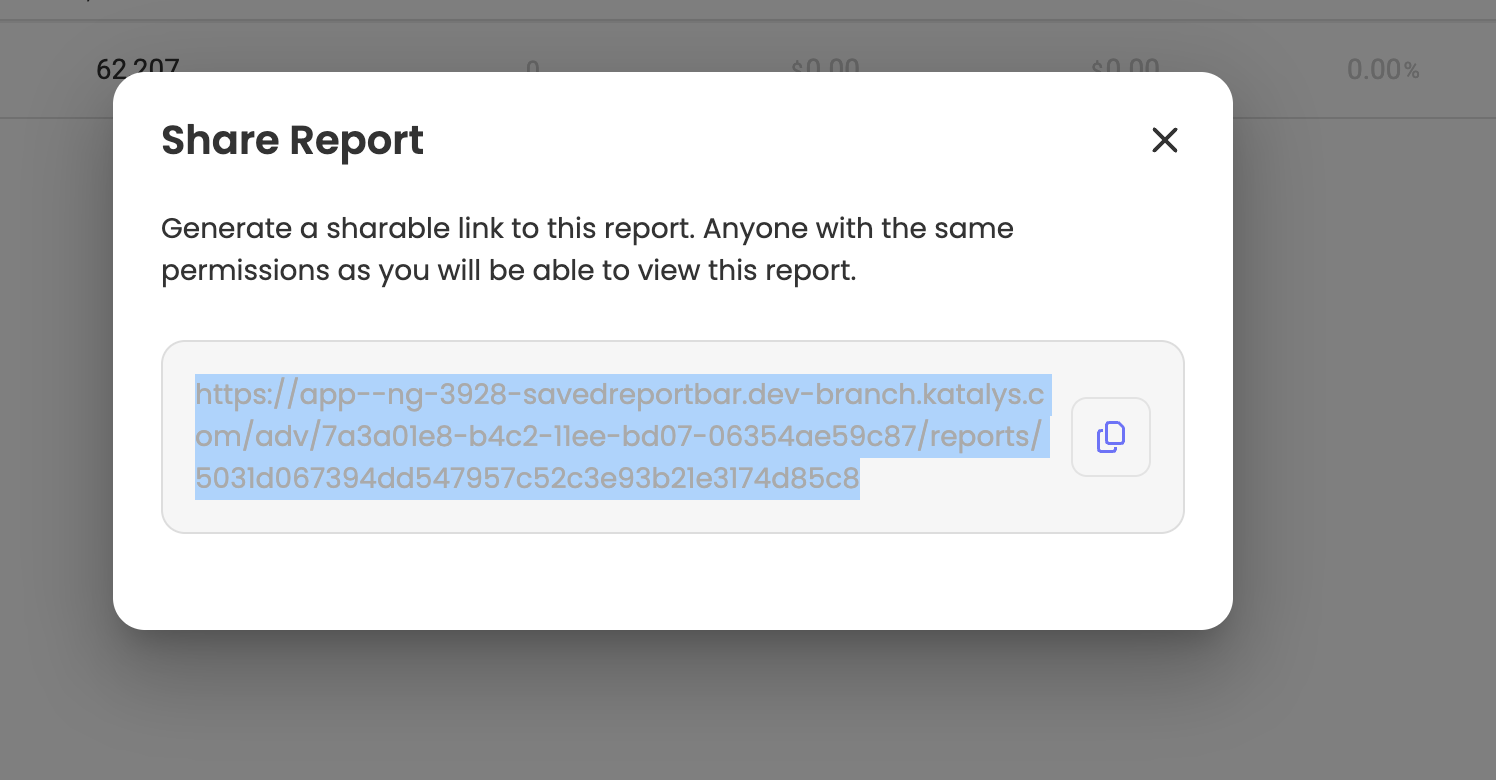
Recipients must have a Katalys account with the appropriate role and permissions. Recipients can modify filters and explore the report independently without affecting your saved configuration.
Share Report vs. Exporting
The table below summarizes the key differences between sharing a report and sharing a view of a report.
|
|
Share Report |
Exporting |
|
What is shared |
The saved report configuration (filters, columns, date range template) |
A snapshot of the current data and layout as the viewer sees it |
|
Recipient can edit |
Yes — recipients can modify filters and explore further |
No — recipients see a read-only snapshot |
|
Data updates |
Live — data refreshes each time the report is opened |
Static — reflects data at the time the view was generated |
|
Best for |
Team members who need ongoing access and want to adjust the report |
Stakeholders who need a quick look at specific results without platform access |
|
Access required |
Recipient needs a Katalys account with appropriate permissions |
Can be shared externally via link (no account required) |
Quick rule of thumb: Share a report when the recipient needs ongoing, live access and may want to adjust filters. Share a view when the recipient just needs to see a specific set of results once, or doesn’t have a Katalys account.