
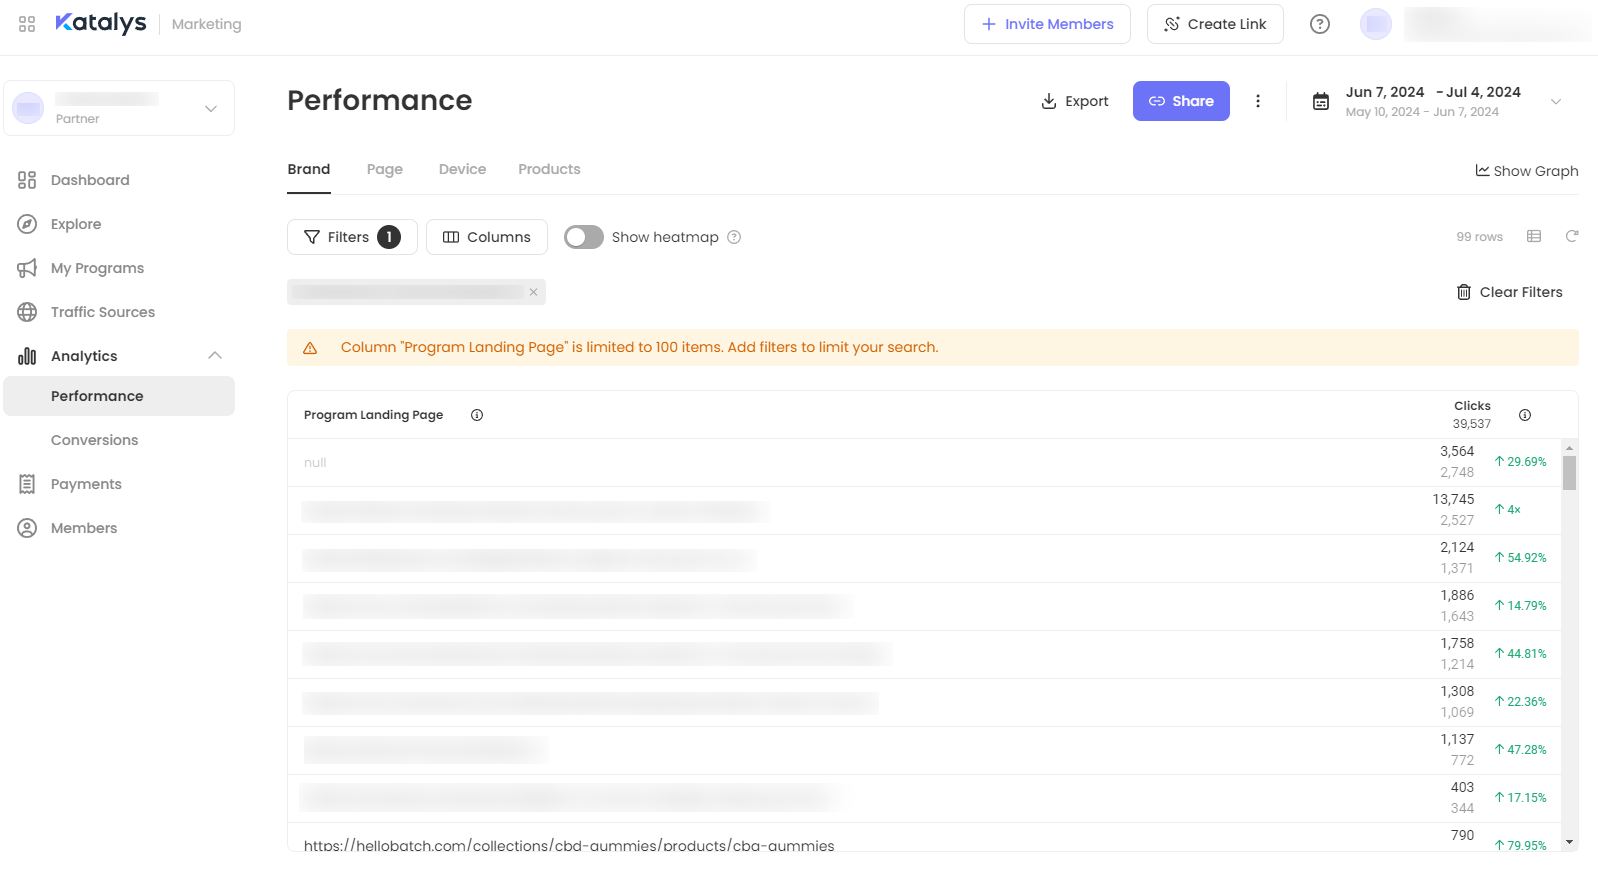
Dashboard is a start page in Katalys Marketing Platform. It comprises the analytics information about your performance. You can drill down into analytics as well as customize your performance reports, using the Reports: Performance and Reports: Conversions sections.
Dashboard: General View
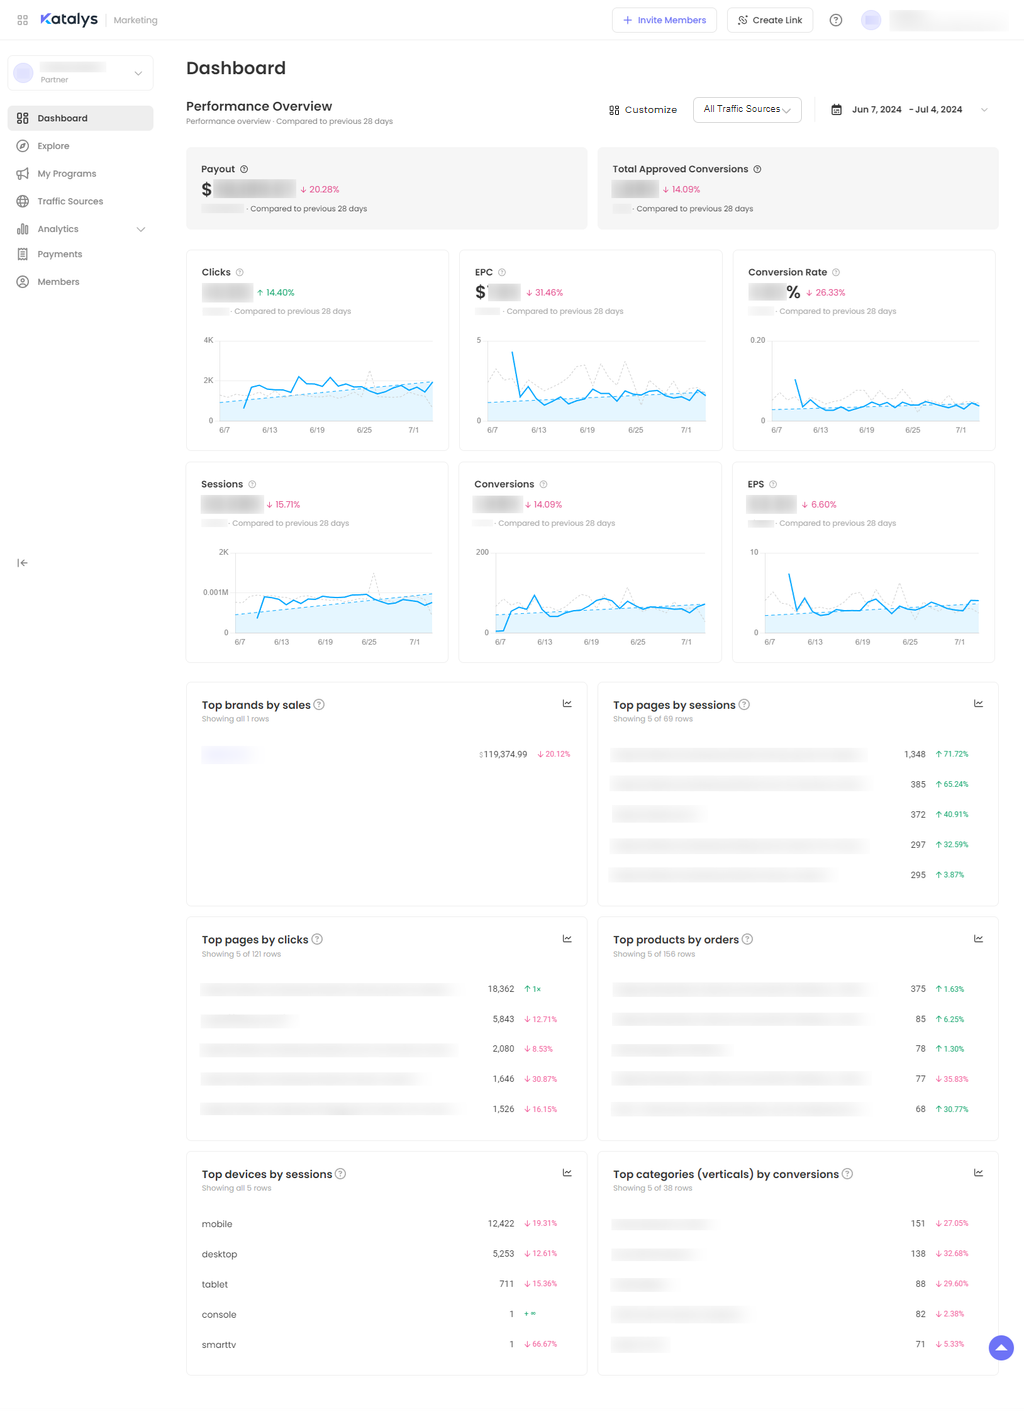
Dashboard presents all the general performance metrics in tables and diagrams:
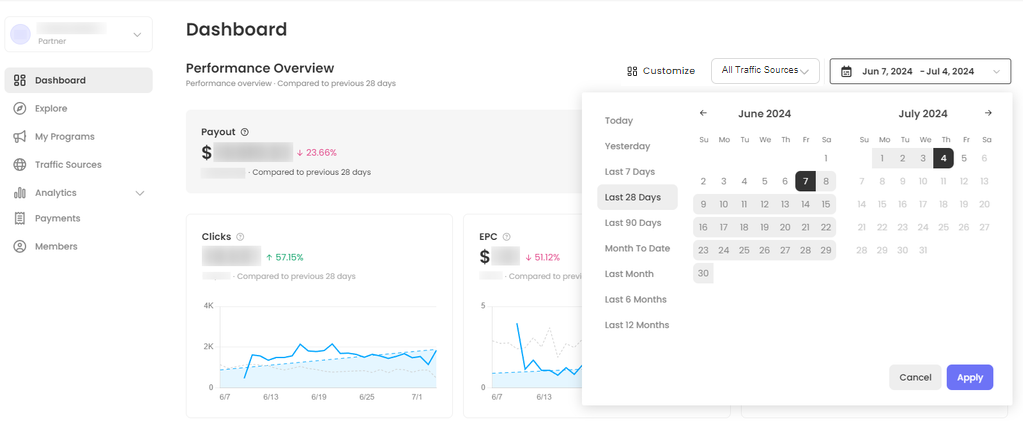
You can adjust the timeframe of the dashboard, using the top right panel:
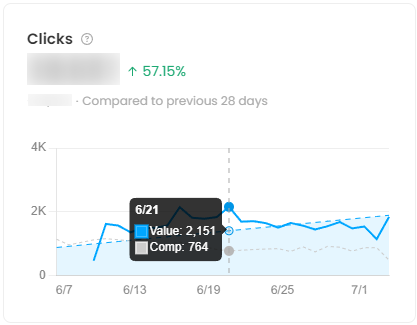
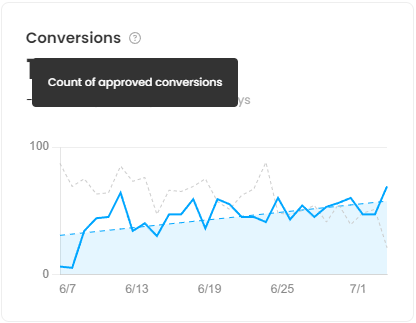
All the diagrams support previewing the values on hovering over the chosen data point:
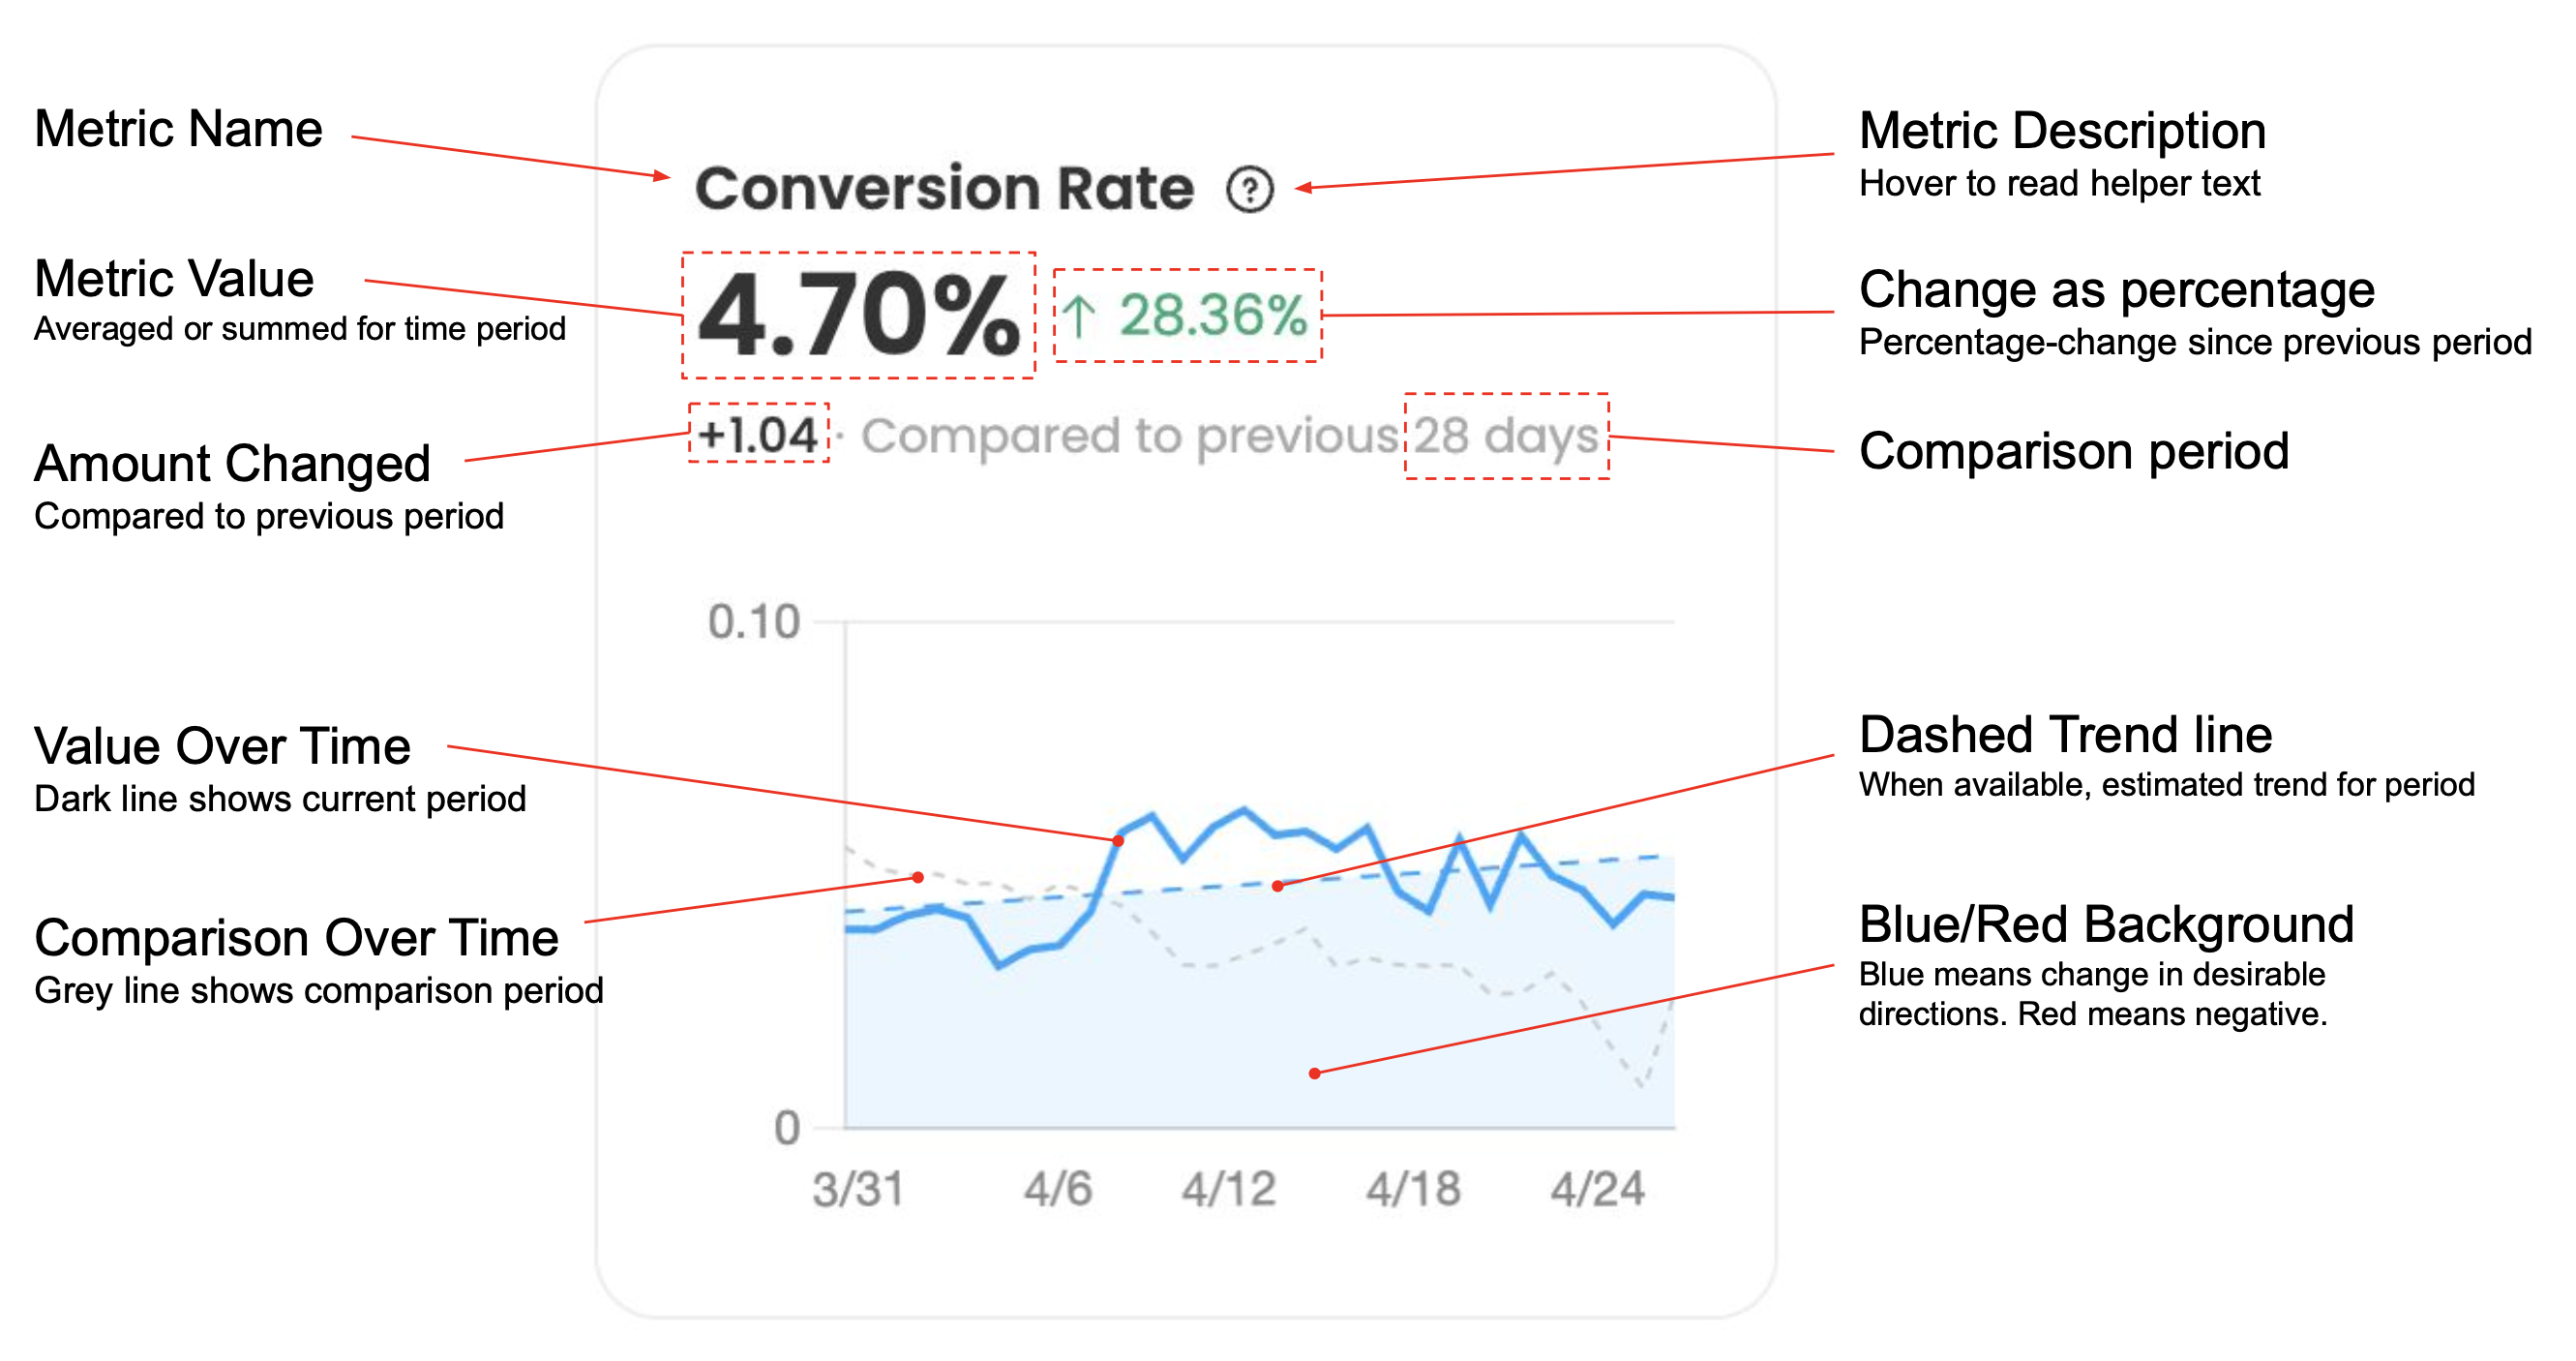
Question mark icons ![]()
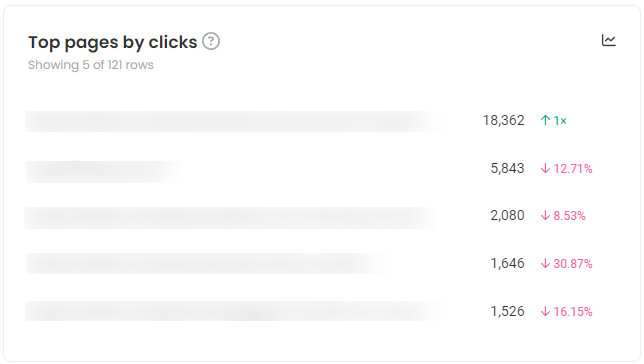
Trend icon ![]()
Dashboard: Display by Traffic Source
By default, the Dashboard represents total figures for all Traffic Sources.
To see the Dashboard for each Traffic Source, use the highlighted dropdown next to the Customize button in the upper right corner of the page:
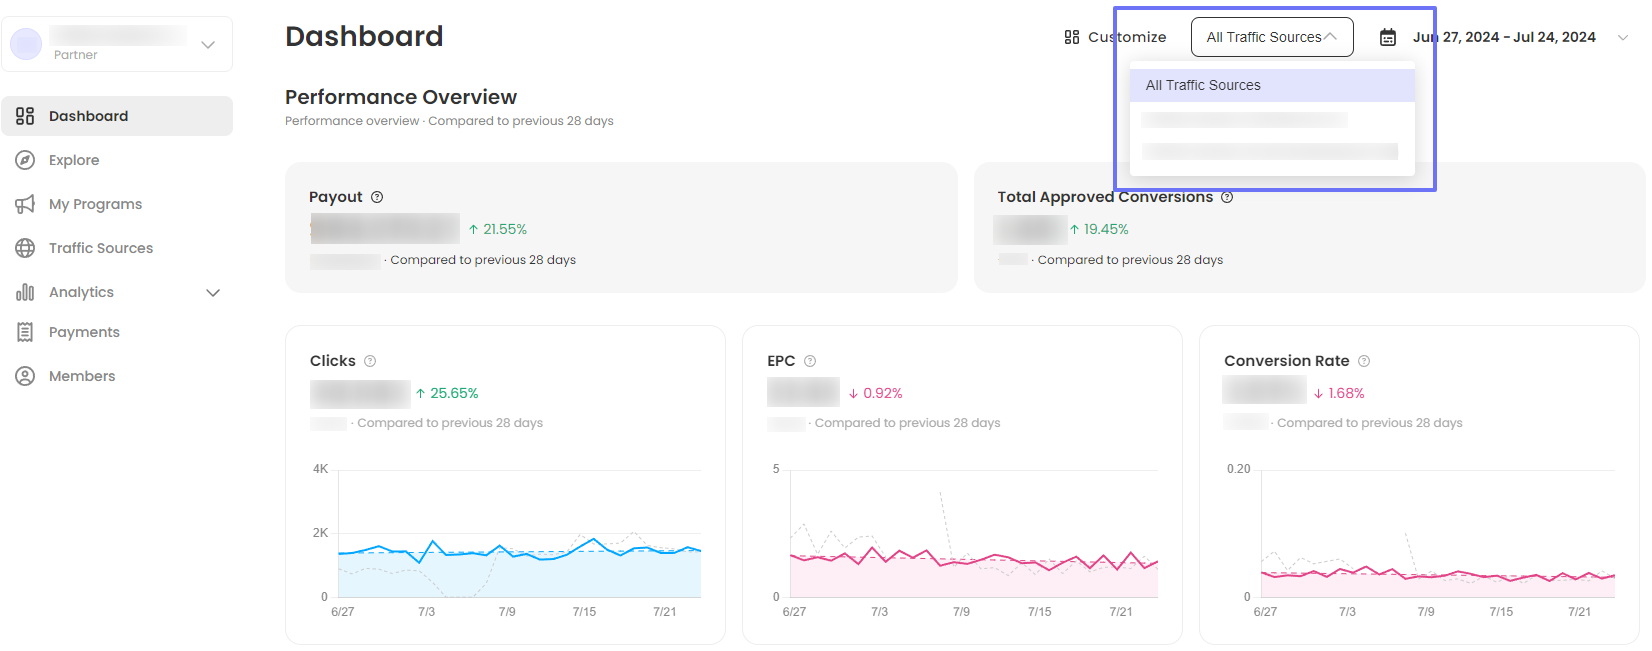
Click on the name of the Traffic Source you want to see the Dashboard for and the figures will change automatically.