Dashboard is a start page in Katalys Marketing Platform. It comprises the analytics information about your performance. You can drill down into analytics as well as customize your performance reports, using the Reports: Statistics and Reports: Conversions sections.
Dashboard: General View
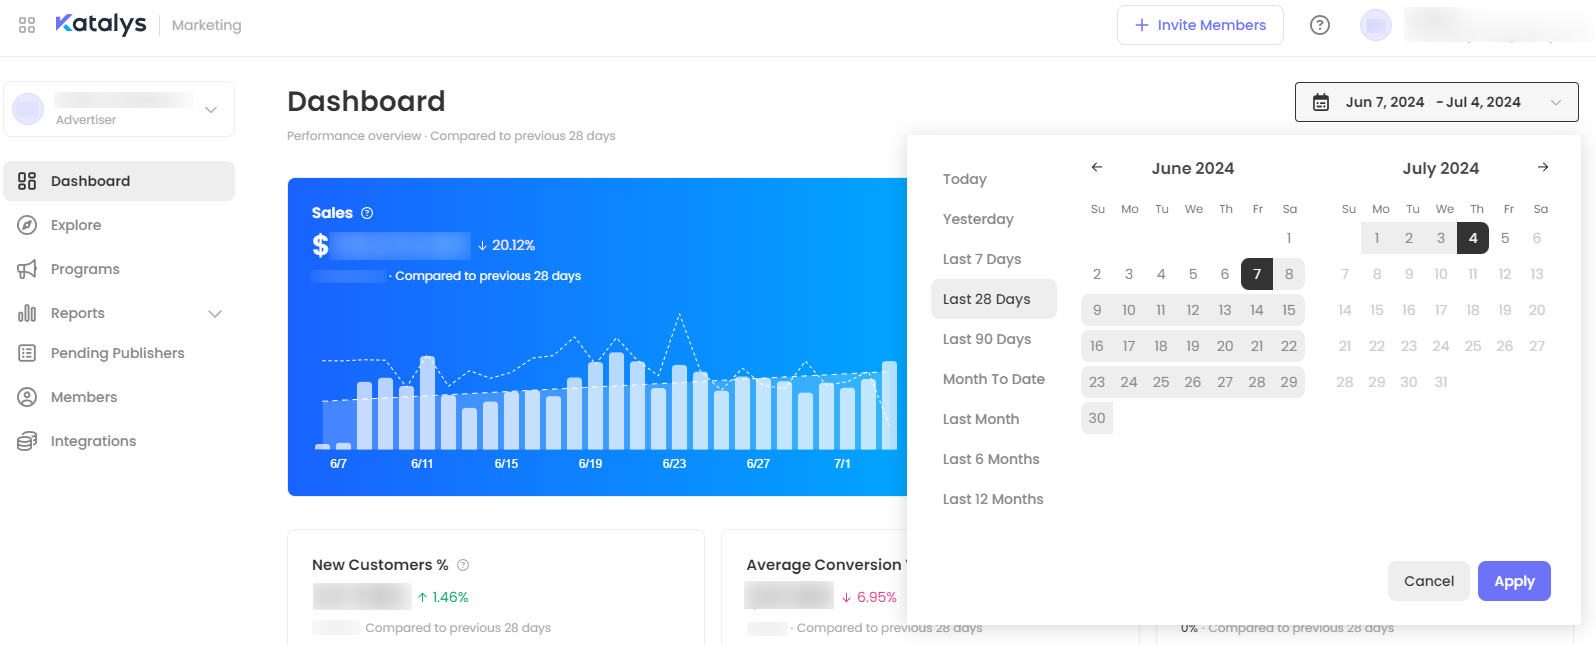
Dashboard presents all the general performance metrics in tables and diagrams:
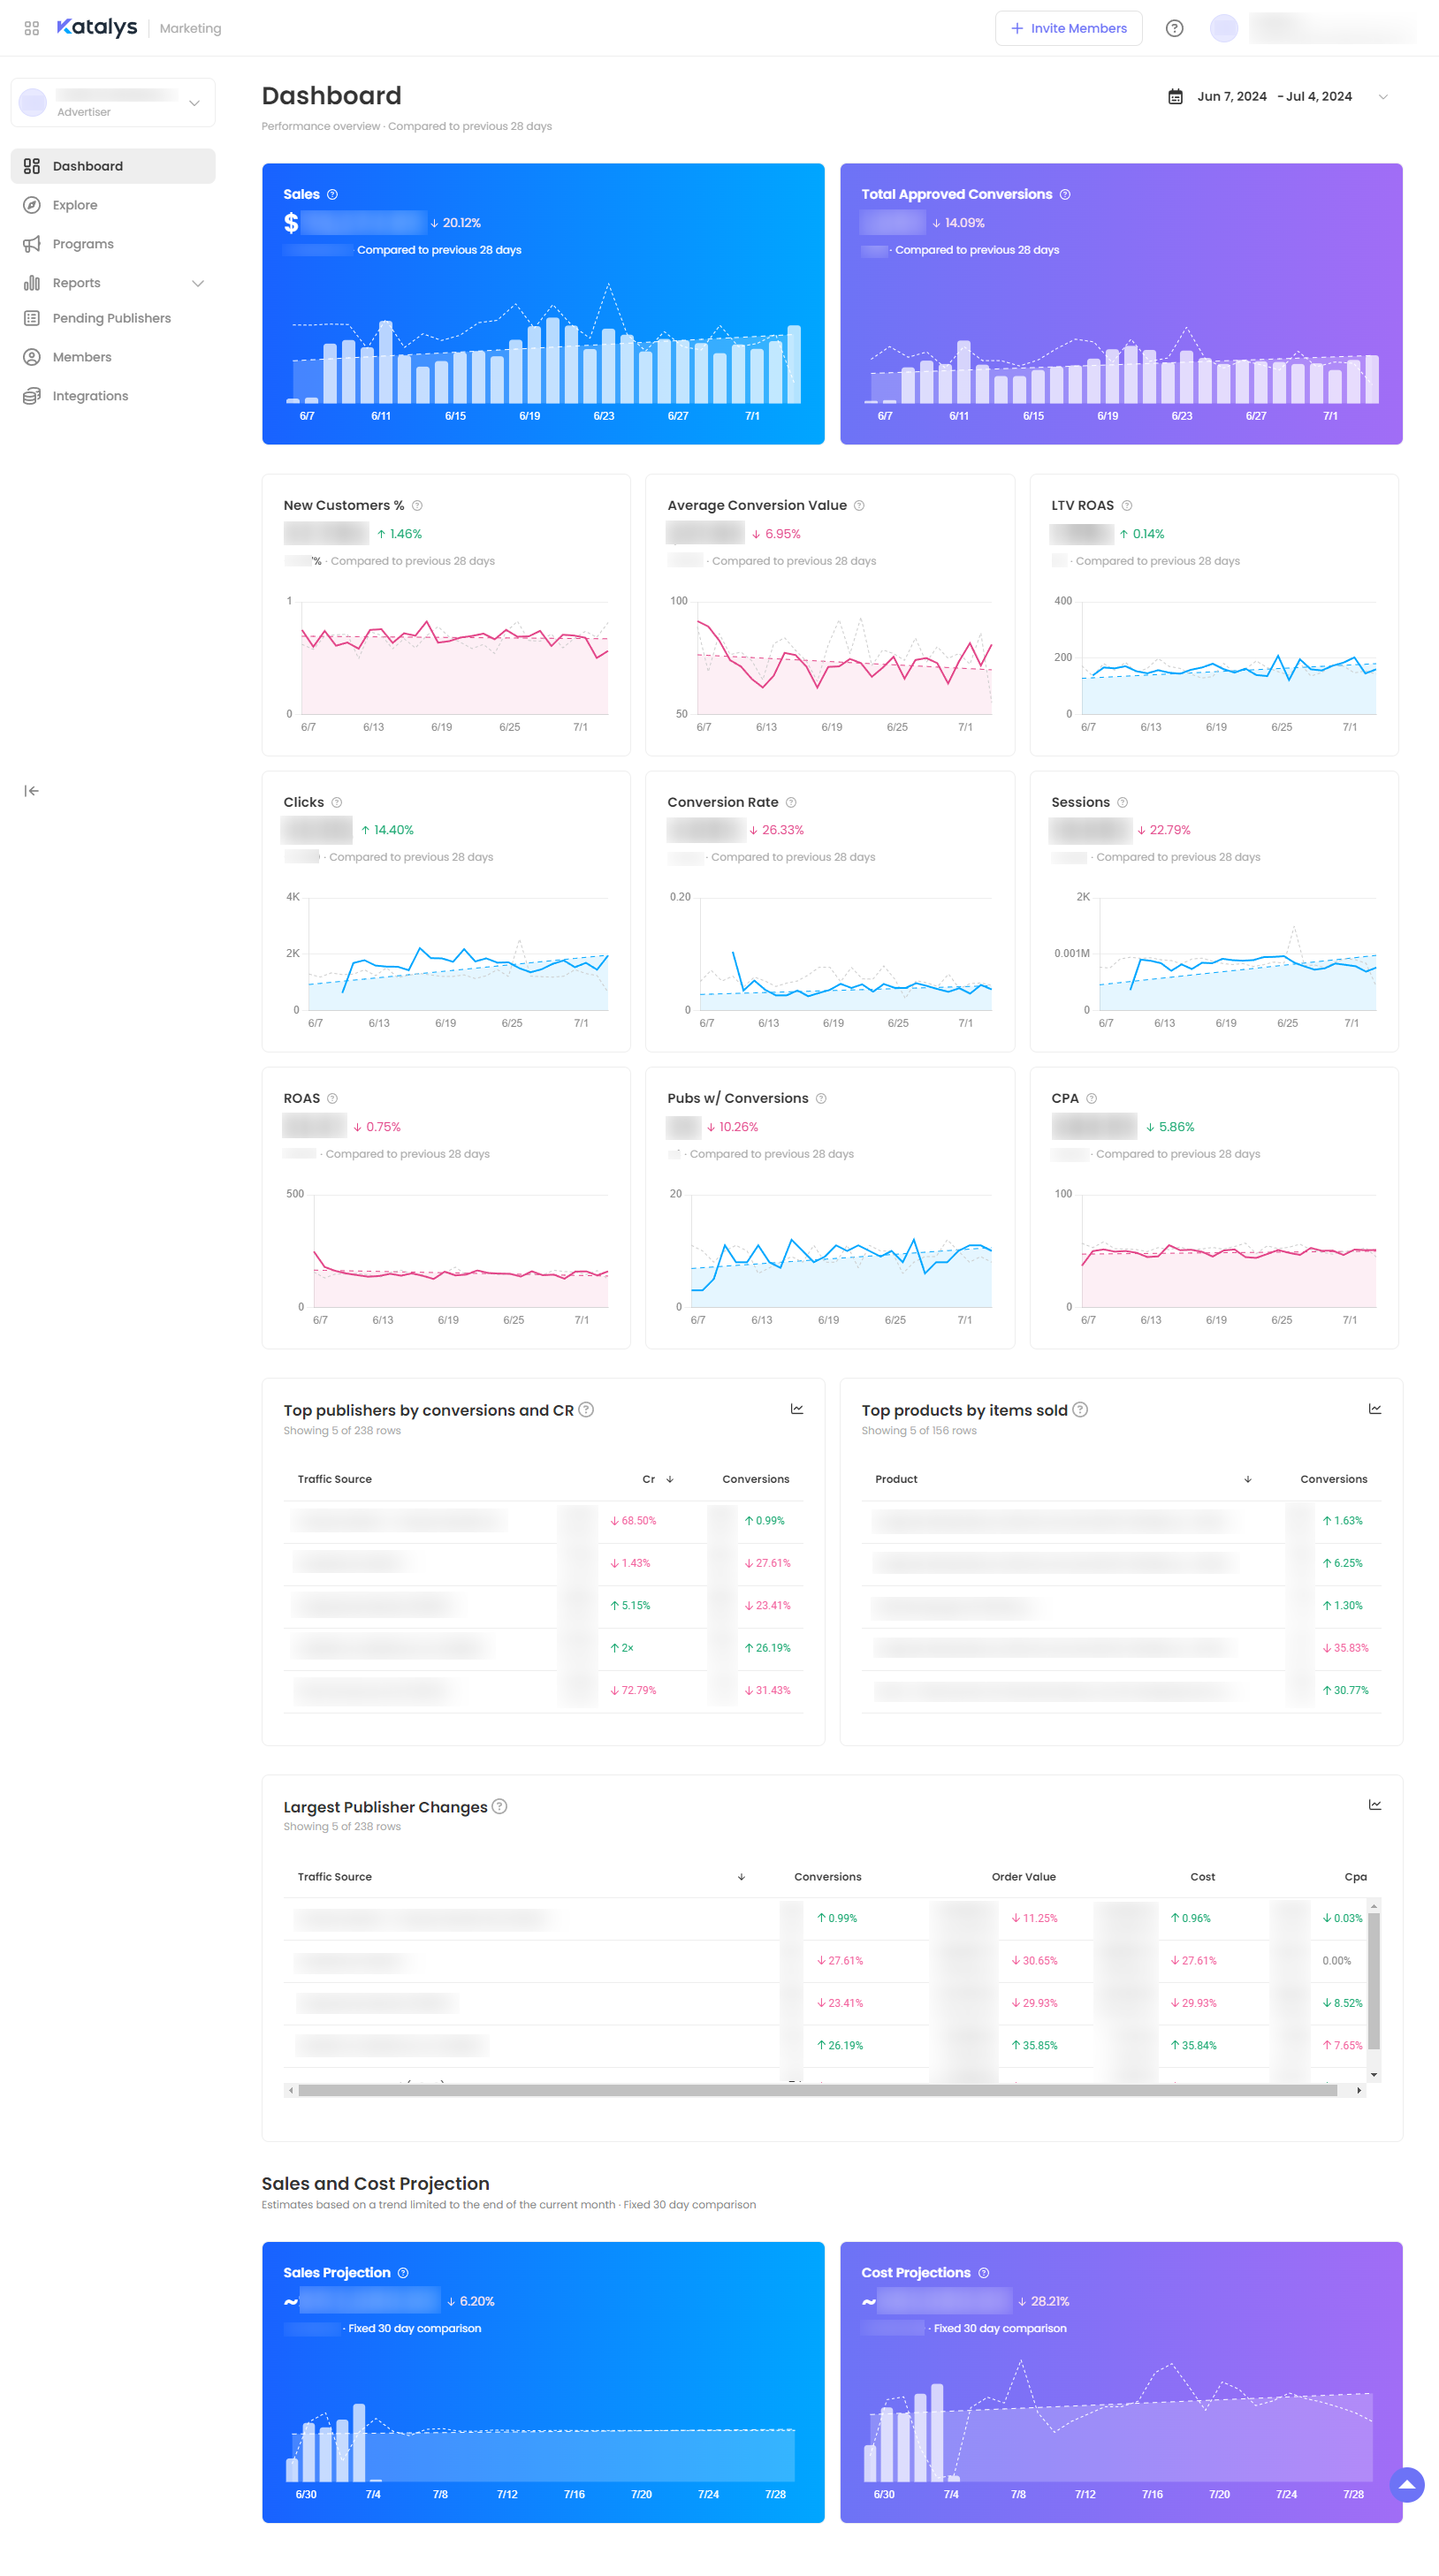
You can adjust the timeframe of the dashboard, using the top right panel:
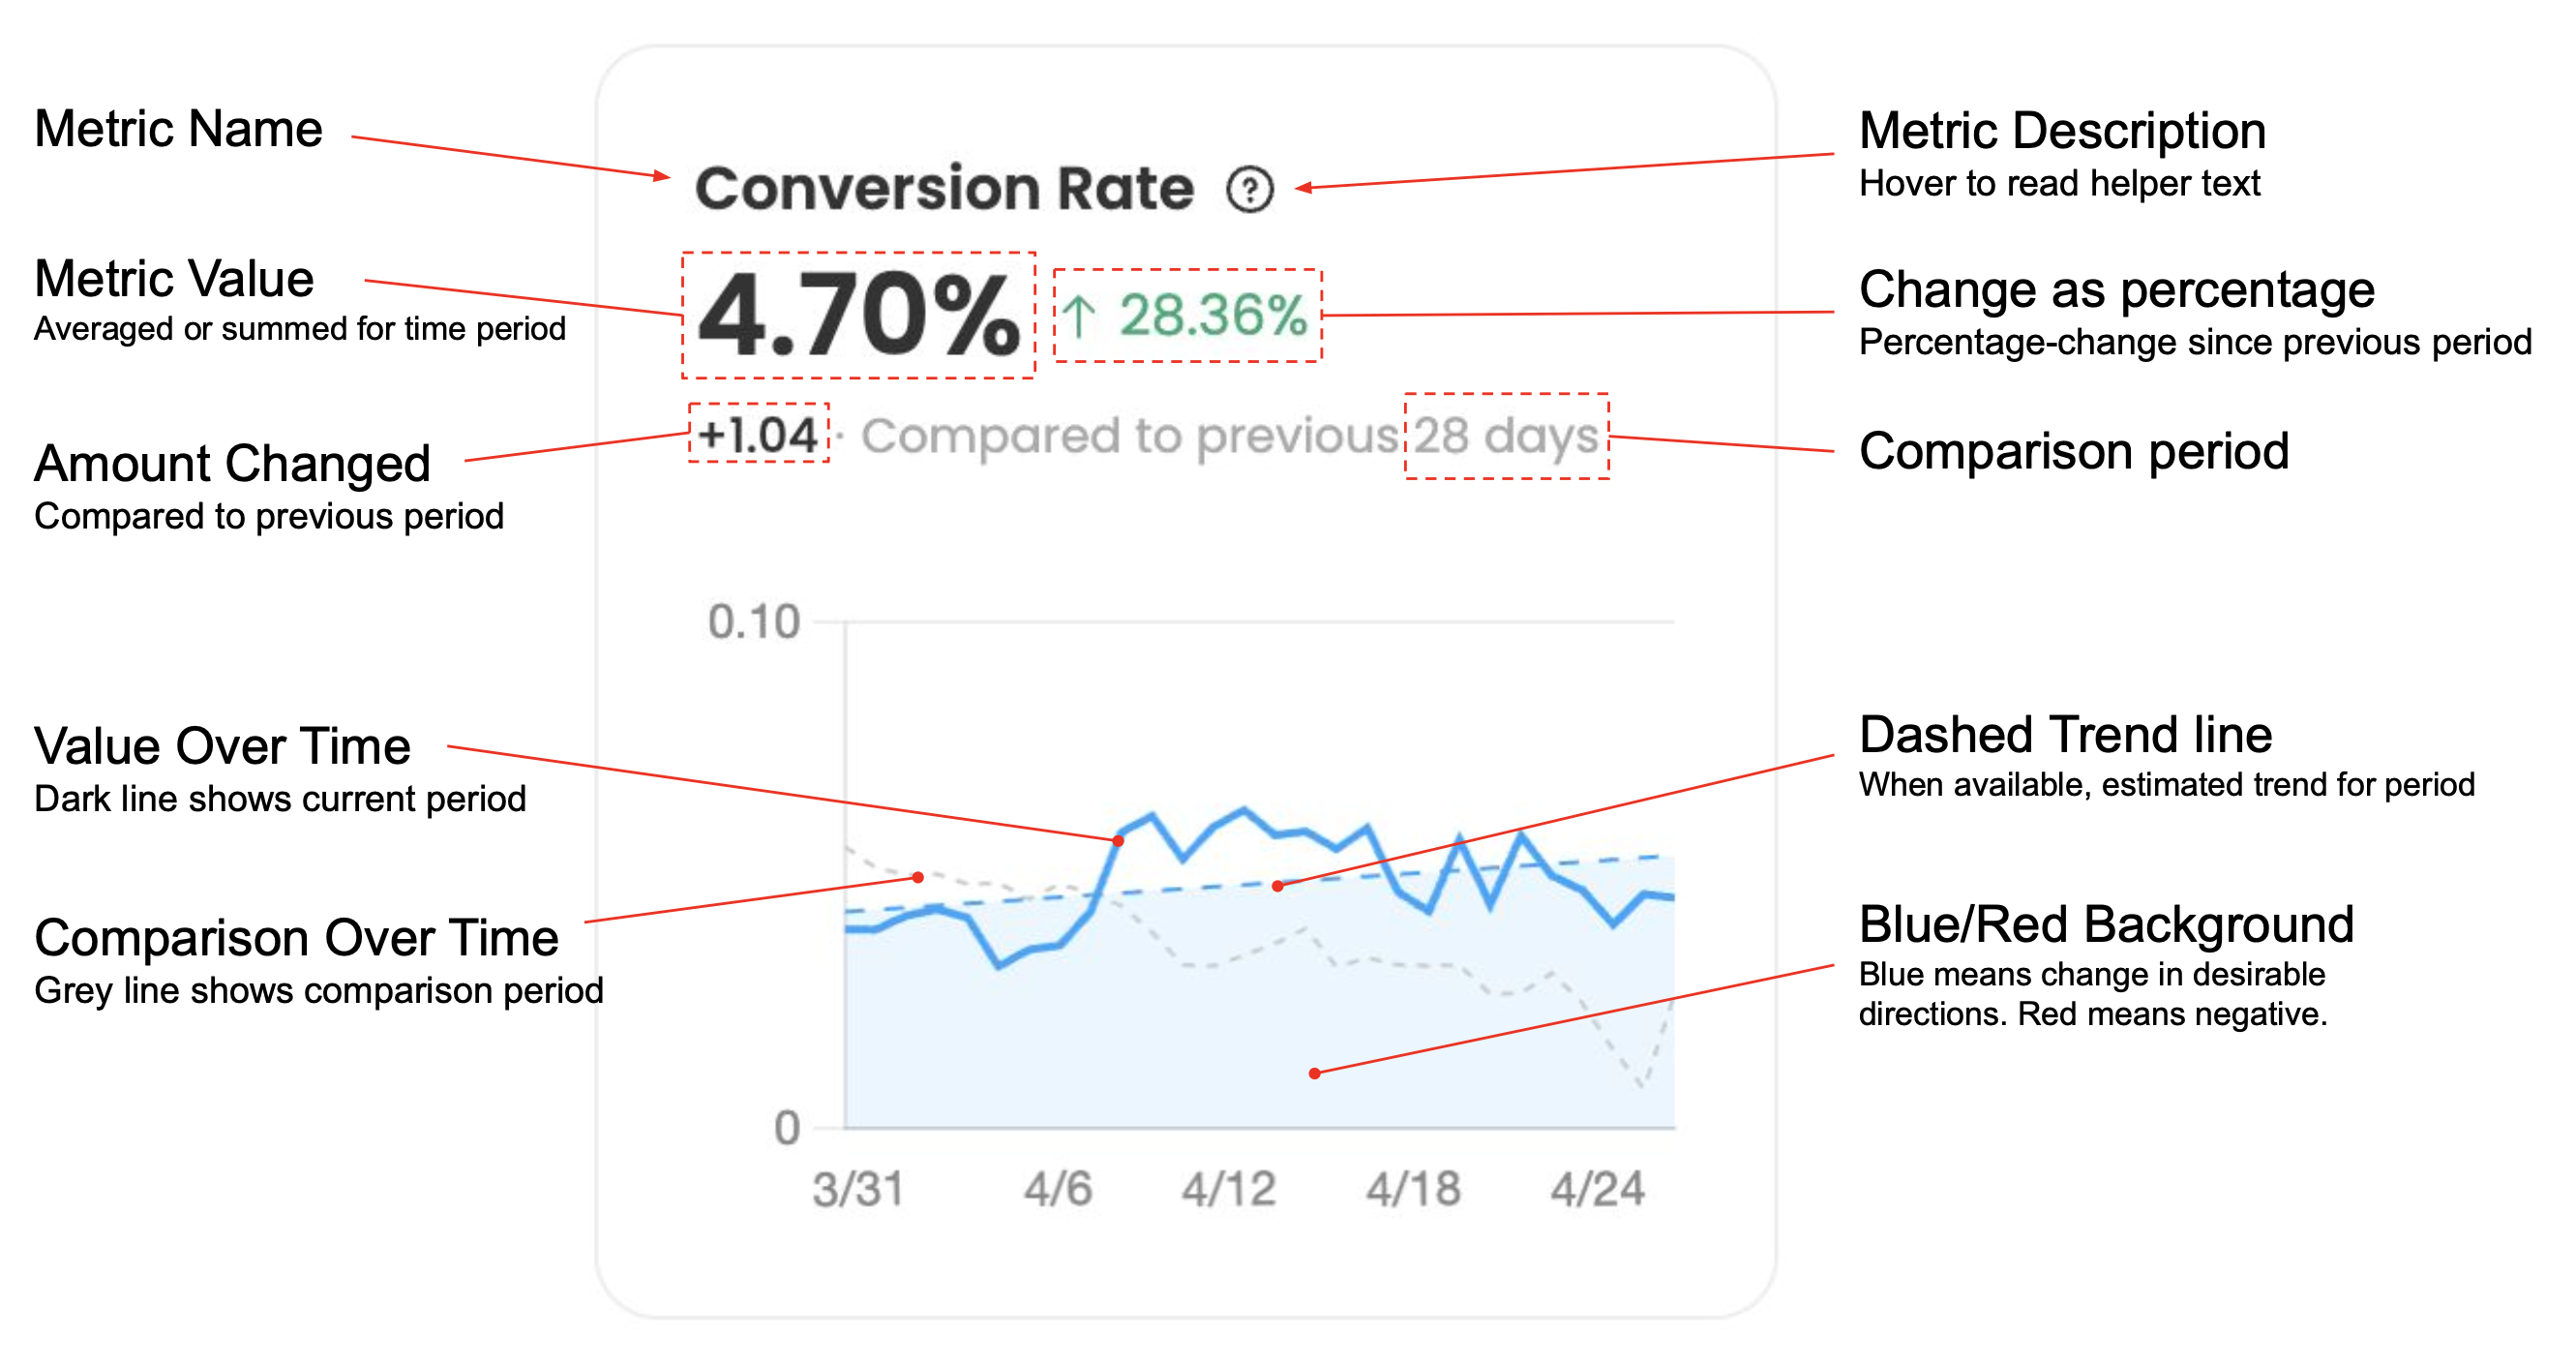
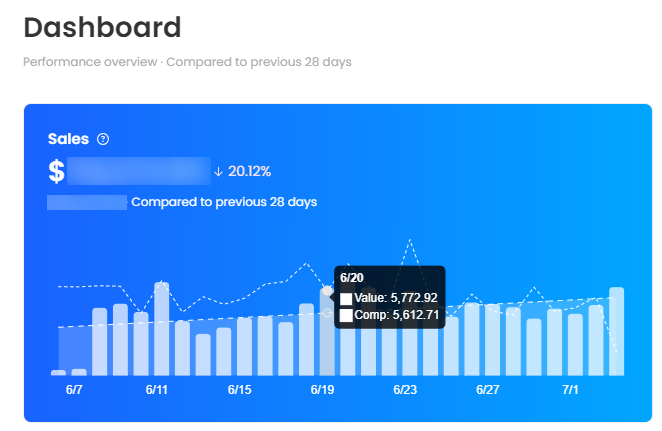
All the diagrams support previewing the values on hovering over the chosen data point:
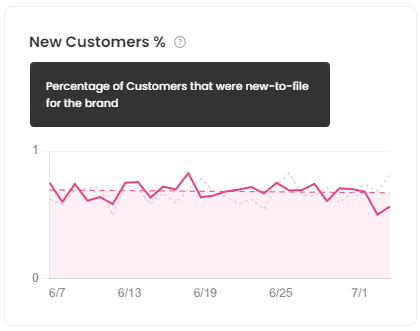
Question mark icons ![]()
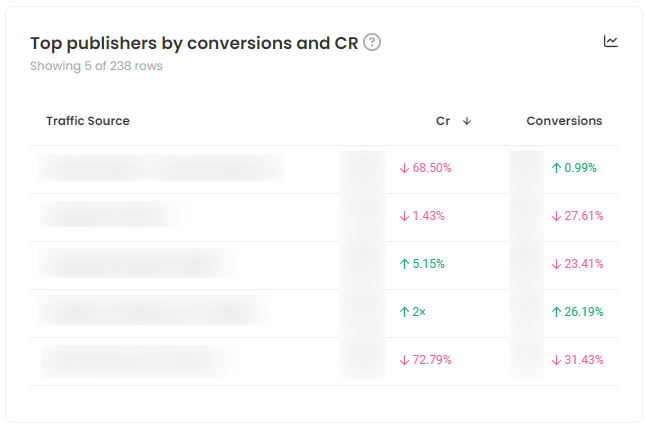
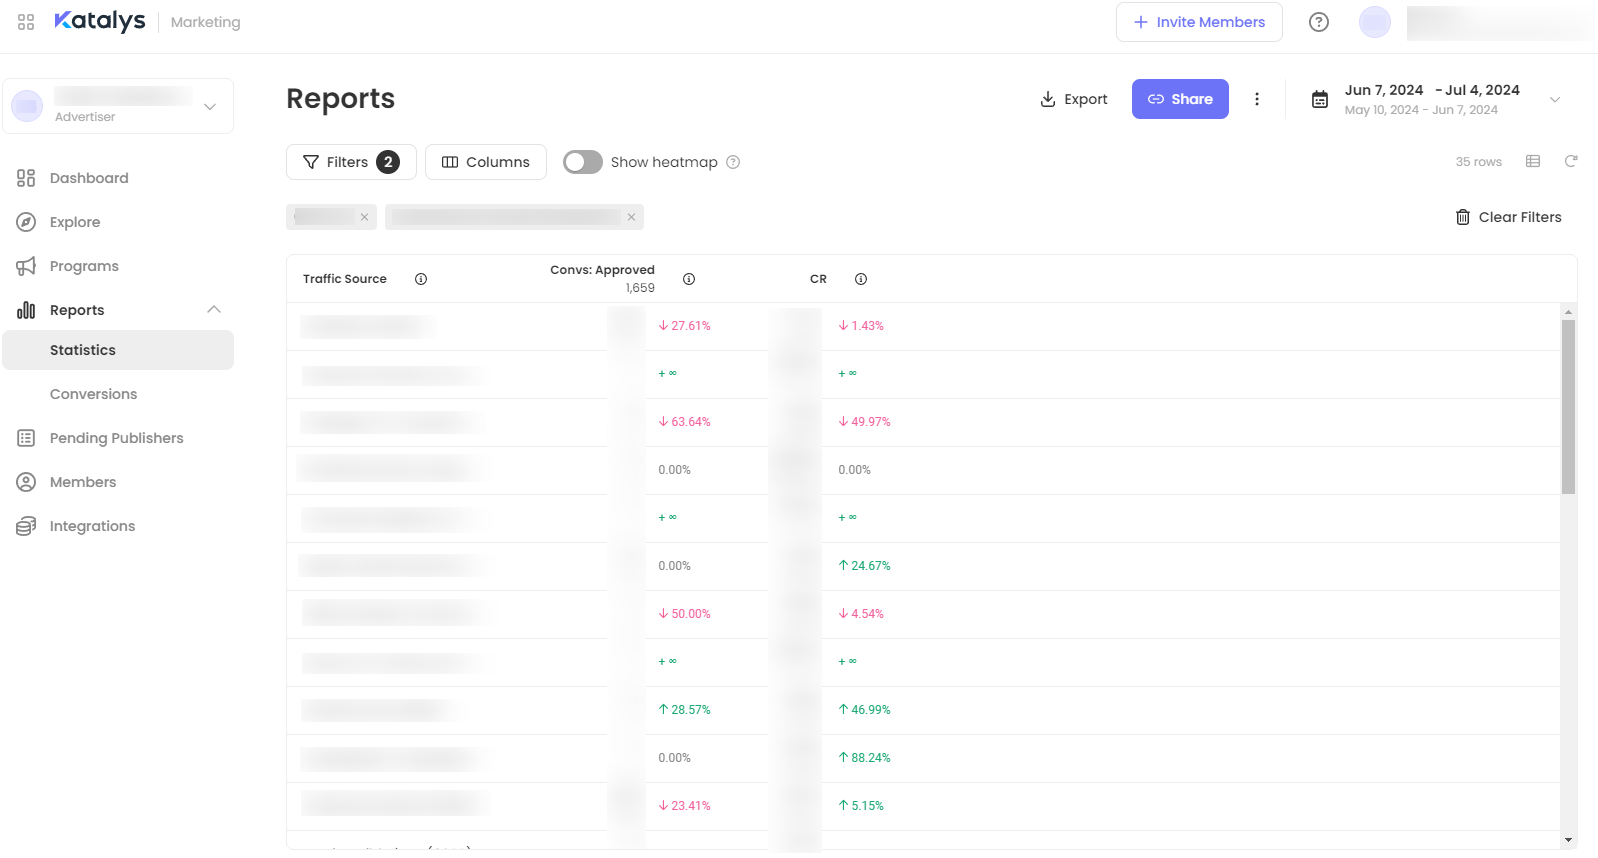
Tables support internal sorting (click arrow icon in the corresponding column to sort the table ascending ![]()
![]()
Trend icon ![]()