
The statistics reporting page in KMP enforces limits when displaying columns with a large number of unique values. When a combination of columns, filters, and date range would result in too many rows, the application collapses values it finds above this limit into the row with the null value.
As an example, imagine a report with 4 values for the column “Partner Sub 1”: ValueA, ValueB, ValueC and null. To limit the column to 3 rows, you would see rows for ValueA and ValueB, then the rows ValueC and null would be combined into one row displayed as null.
What It Looks Like
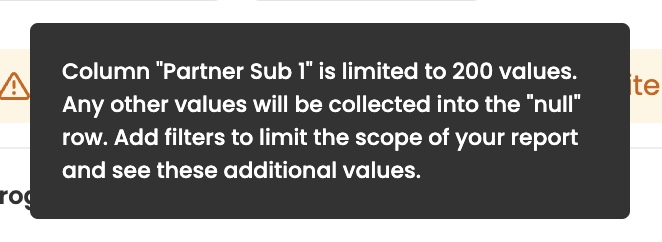
When this behavior is triggered, you will see a message similar to this in KMP:
When using the API, this is the message you might see returned:
{
  ...
  "warnings": [
    "Column \"Partner Sub 1\" is limited to 200 items. Add filters to limit your search.
"
  ]
}
How to Work Around This
To work around these limits, take the following actions:
-
Reduce your report’s date range.
When you reduce the date range, you restrict the number of rows returned and might no longer hit these column limits. -
Add filters to find just the data you need.
By limiting your results to specific filtered values, the scope of the report might fit within the column limits. -
Download a Conversion Report.
If you must see every value, you can run your own report. Download a Conversion report using the “Conversions” page and clicking “Export”. Open up the file in Excel or Google Spreadsheets and produce a pivot table.